Road Sign Detection
The goal of this project was to use computer vision techniques to label road signs. The state-of-the-art would often be machine learning, but for this project I focused on comprehending the structural and semantic aspects of an image. This includes working with images as 2D and 3D arrays, applying edge detection, identifying lines and basic shapes, and addressing the presence of noise or distortion in an image.
This first section covers some mathematical background that is useful to understand before beginning this project. If you want to skip to the code, head down to Applying the Math.
Mathematical Foundations
When attempting to detect shapes in an image, what are some important features to find that will help interpret the contents of an image? The first thing to look for would be all the edges in an image. We can visually distinguish edges when looking at an image by looking for areas with a sharp contrast between them. To compute this mathematically, we need to find where in the image is there a sharp change in pixel values. Change in a function is evaluated by the derivative. So, to find change in an image, we can take a line of pixel values and compute the partial derivatives along that line. This vector of partial derivatives is called the gradient operator. For an image, the coordinates are identified by x and y, which means the gradient operator will be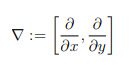 There is a problem here though. If we calculate the differences stepping in the horizontal direction, vertical edges will be favored over horizontal ones. This is because we are moving across the vertical edges while moving horizontally. Meanwhile, the horizontal edges will be a lot more subtle. The opposite also applies when stepping in the vertical direction. The image below shows this effect in action. On the left is the representation of taking the partial derivative with respect to x, and on the right is the partial derivative with respect to y.
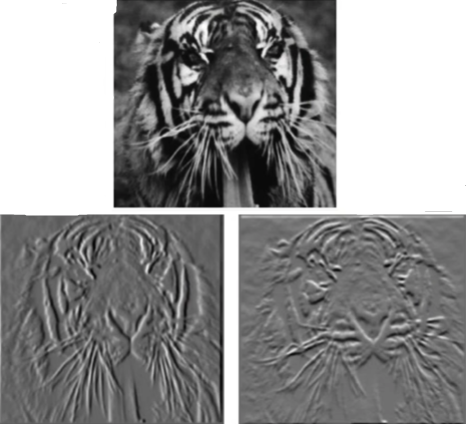 The solution to our problem is the Sobel operator. The Sobel operator consists of two 3x3 convolution kernels. One kernel responds maximally to vertical edges; the other kernel is rotated 90 degrees and responds maximally to horizontal edges. The result of applying each of these kernels to an image is combined to produce an edge image. The Sobel operator is very computationally efficient but comes at the cost of only being good but not great. For our purposes, road signs will generally have very sharp edges from the background of the image so good will be completely sufficient.
 The next step is to perform something called Non-Maximal Suppression. Basically, this is just looking in the gradient direction and removing all pixels which are not the brightest. This results only in pixels in which we are very confident are edge pixels. This step is very aggressive though. It leads to the removal of pixels that are edge pixels, they just aren't maximal pixels. The solution is to note which pixels are "weak" edges. If those weak pixels are found to be along/between strong edge pixels, then they are included as edge pixels.
The process I have just described is referred to as the Canny edge detector. Later, we will be using OpenCV to apply this to an image.
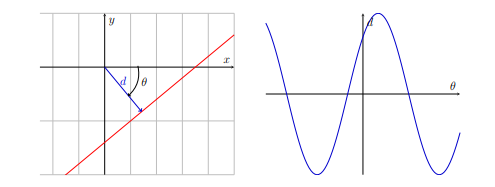
Lastly, we need to find lines from these edge pixels. Even after performing an edge detector algorithm, there is likely to be a lot of noise in an image with erroneous edge pixels and unneeded lines. To find the lines, a voting algorithm will be implemented where each pixel votes for its possible lines. The polar representation of a line identifies a line by d, which is the perpendicular distance between the line and the origin, and by θ, which is the angle of that perpendicular line with the x-axis. The relationship between the polar and Cartesian representation of a line is depicted by: x cos θ + y sin θ = d. We know the value of x and y for each edge pixel. Those pixels can then vote for their possible lines with a sinusoidal representation of all possible lines that run through that edge pixel. In the image below, the left represents a line in polar space and the right is the same line's sinusoidal representation.
 The voting process looks like this:
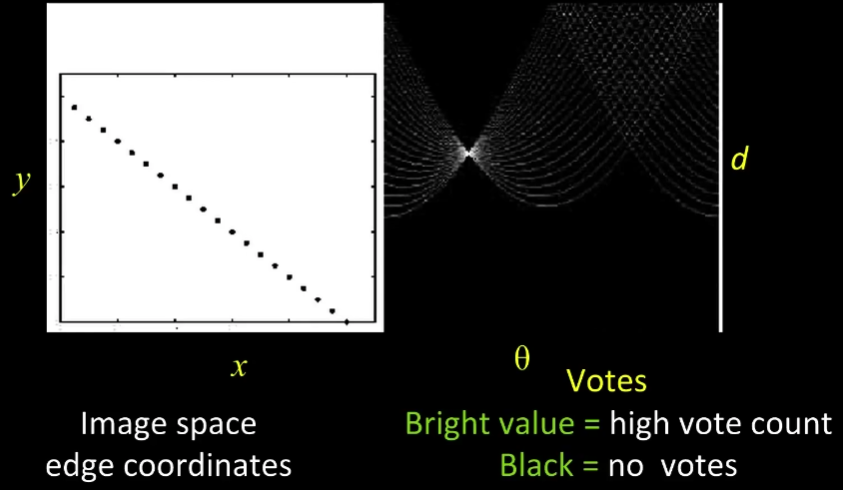 The brightest pixel indicates where a line is found. The coordinates of this pixel in the sinusoidal representation represent d and θ. This gives us all the information we need to determine where the lines are in an image.
Applying the Math
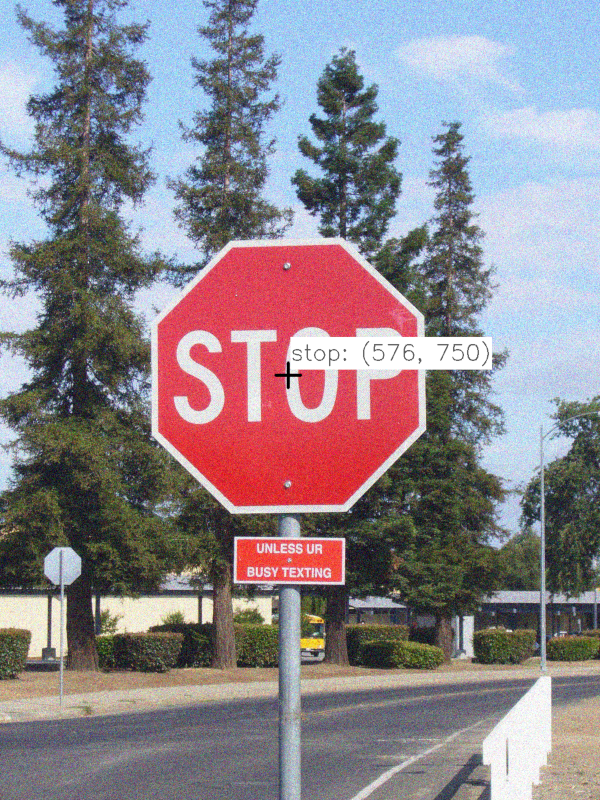
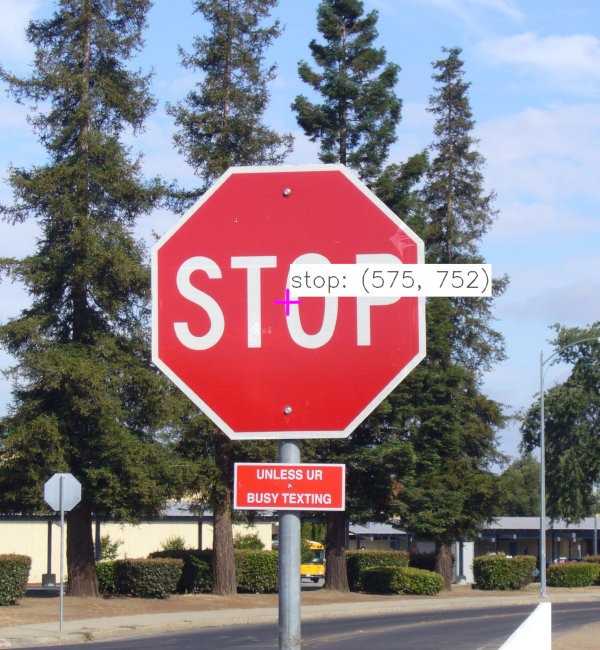
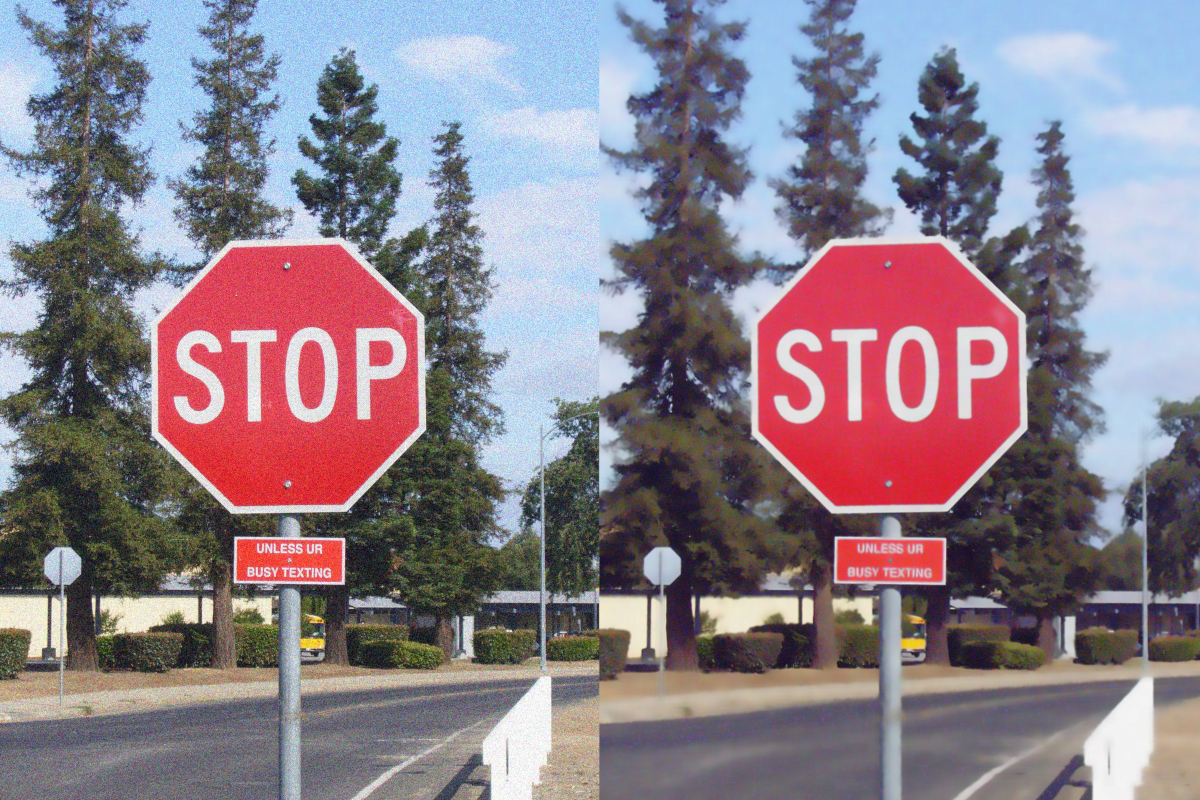
There is a similar, but slightly different process for detecting each road sign. For this demonstration, I will be walking through how I detected stop signs.The first step is to pre-process the image. The input image (left) has had some noise added to more closely resemble the type of image a self-driving car would be working with. The image on the right is after I applied cv2.fastNlMeansDenoisingColored(). It's not a perfect outcome but it helps with the later steps.
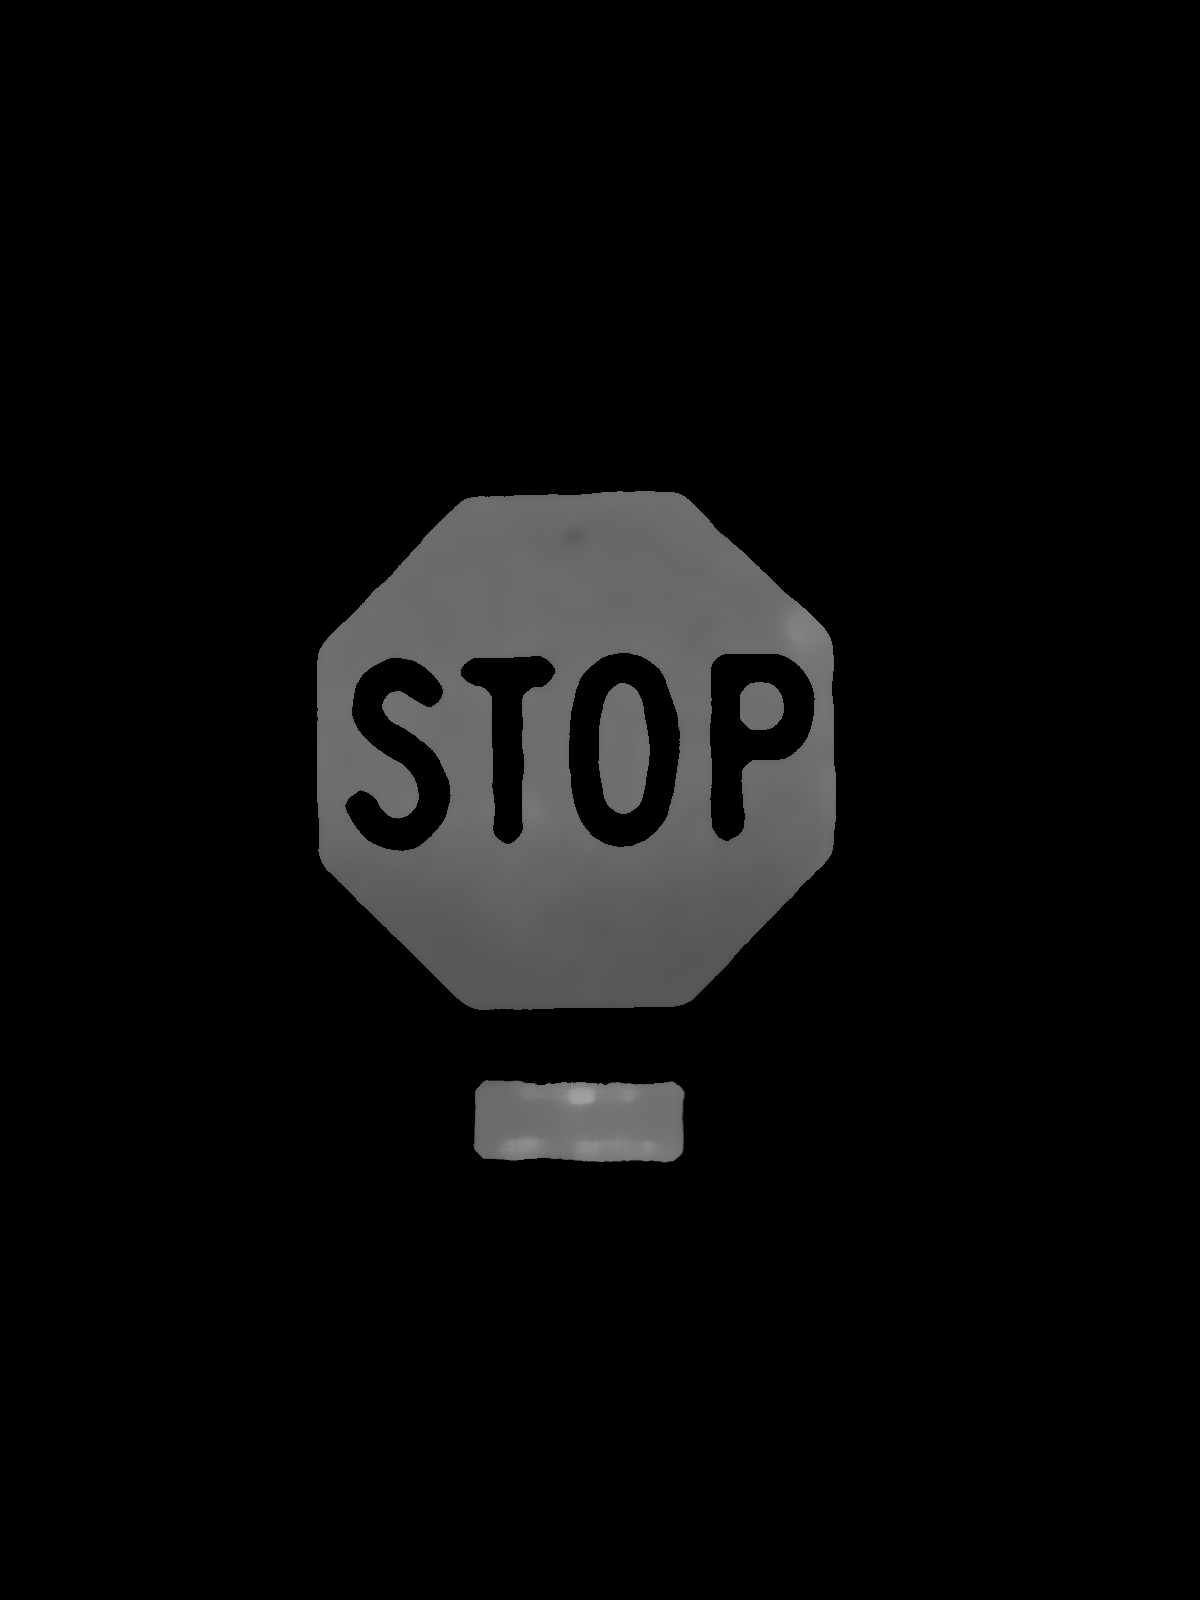
 I know stop signs are going to be some variation of the color red. So, the next step was to filter out all non-red colors from the image. After the non-reds were filtered out, I converted the image to grayscale to prepare it for the Canny edge detector.
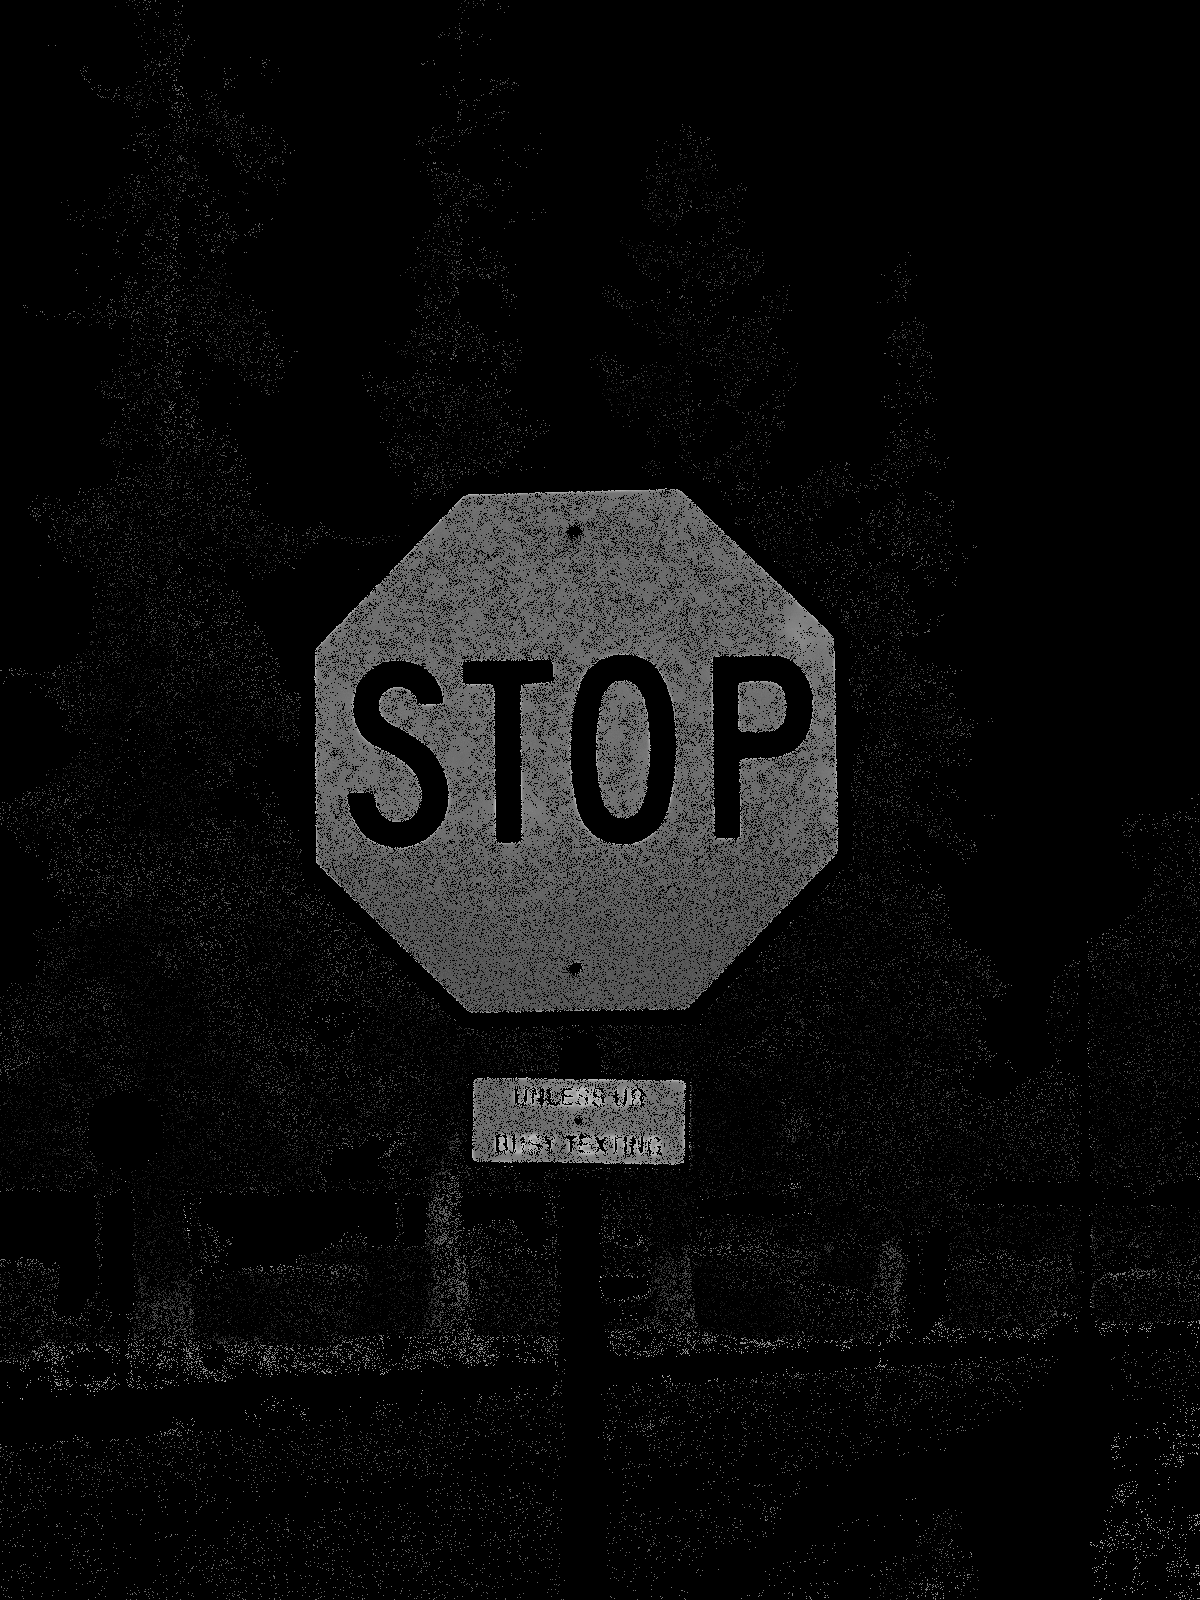 There were still a lot of unwanted pixels from the background and many small holes in the stop sign. Despite that, the bulk of the stop sign was intact, and the background was mostly cleared out. To finish the job, I applied a median filter across the entire image to smooth out those irregularities.
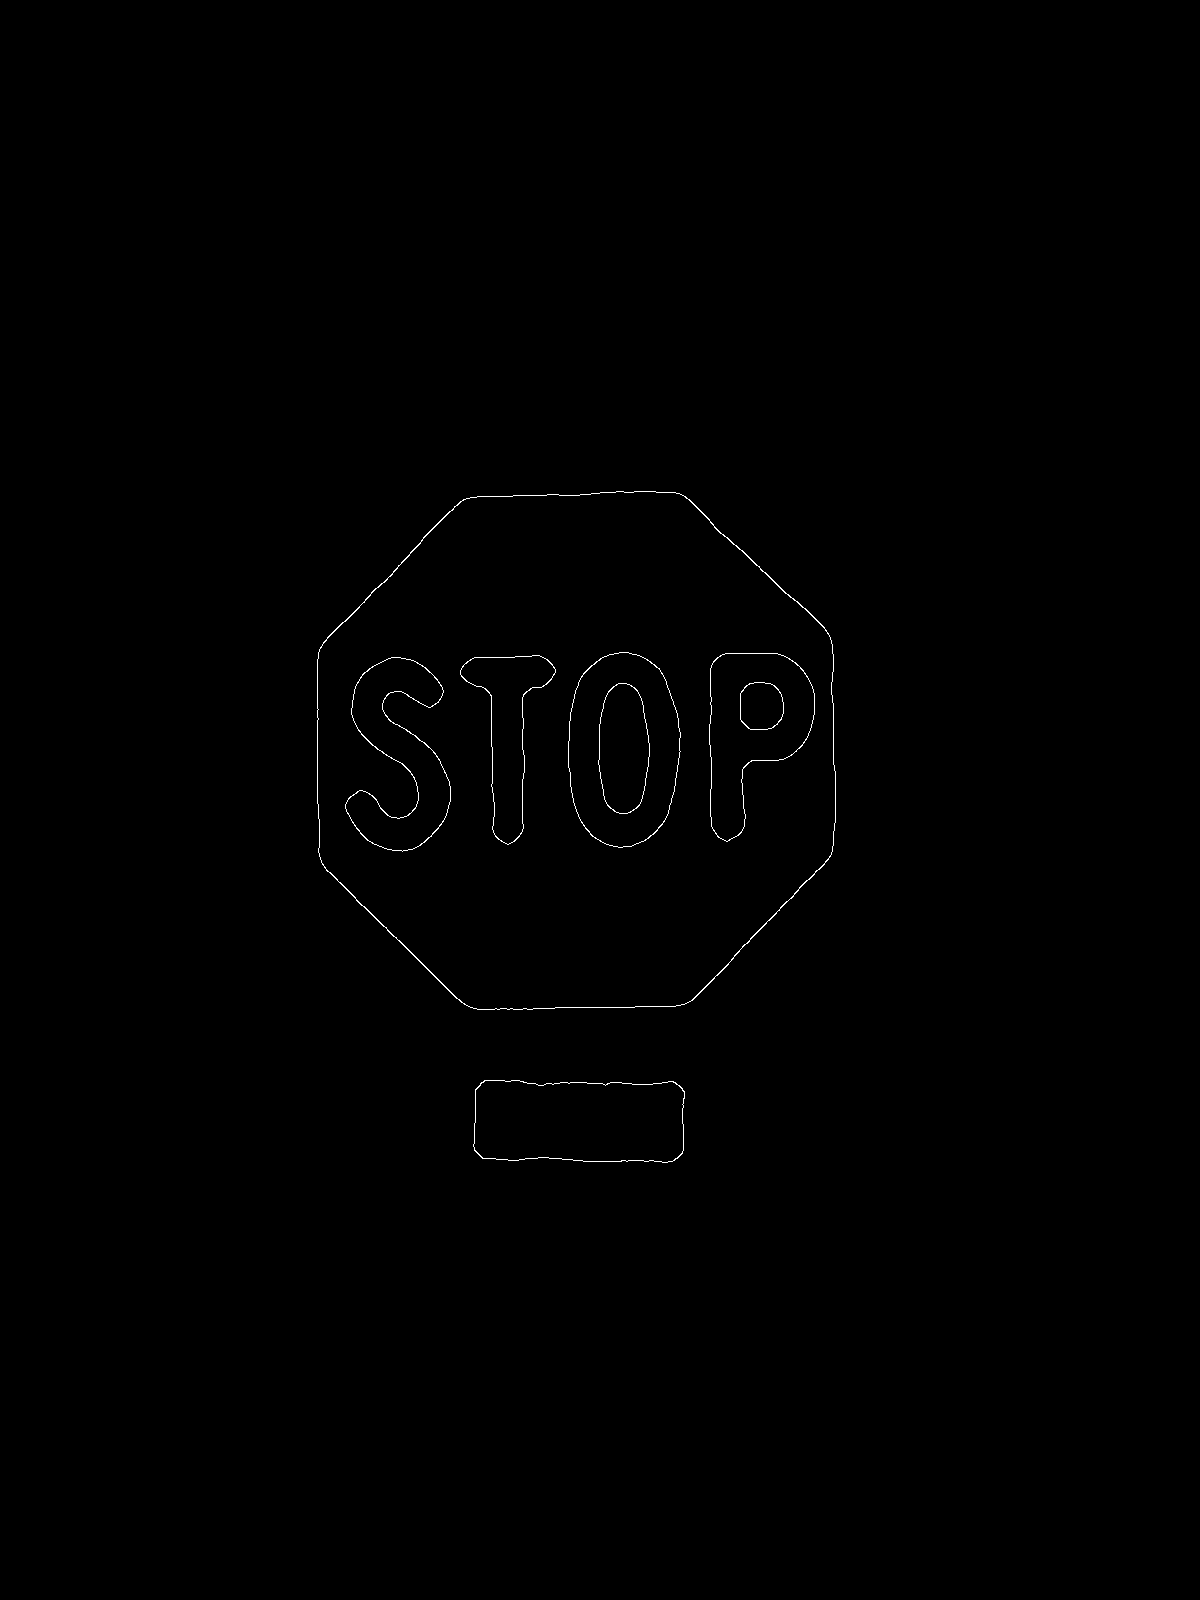
 At this point, the image was ready for the Canny edge detector. The result can be seen below.
 Now it is time to determine where the lines are in the image. Using the line detection method described in the math foundations, I was able to acquire a list of all the lines detected in the image. I avoided using horizontal lines because there will often be horizontal lines in images which aren't related to road signs such as the horizon or buildings. But a stop sign also has two pairs of parralel lines at the 45- and 135-degree angles. I calculated the angle of all the lines I found and searched for those two pairs. With those pairs found, I calculated where they intersected which gave me a diamond shaped box located directly over the stop sign. Locating the center of the box yielded the center of the stop sign.
Result